
Memory Bandwidth Napkin Math
February 9th, 2020
A few weeks ago I had lunch with a co-worker. He was complaining about some process being slow. He estimated how many bytes of data were generated, how many processing passes were performed, and ultimately how many bytes of RAM needed to be accessed. He suggested that modern GPUs with upwards of 500 gigabytes per second of memory bandwidth could eat his problem for breakfast.
I thought his perspective was interesting. That's not how I think about problems.
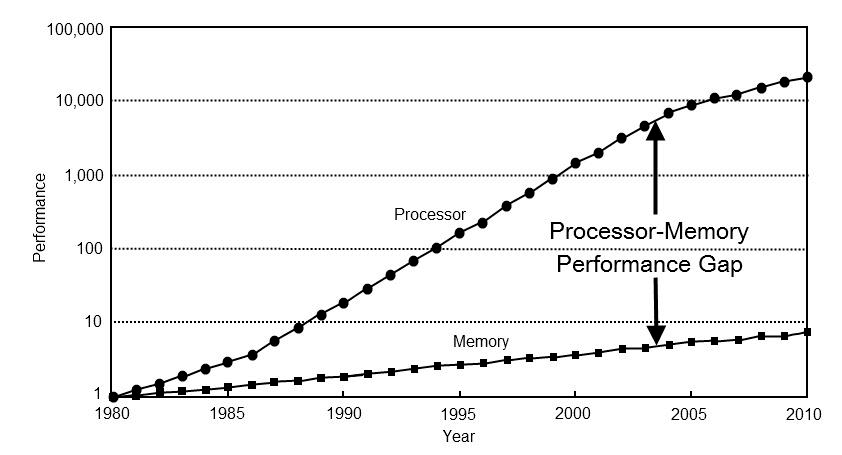
I know about the processor-memory performance gap. I know how to write cache friendly code. I know approximate latency numbers. But I don't know enough to ballpark memory throughput on a napkin.
Here's my thought experiment. Imagine you have a contiguous array of one billion 32-bit integers in memory. That's 4 gigabytes. How long will it take to iterate that array and sum the values? How many bytes of contiguous data can a CPU read from RAM per second? How many bytes of random access? How well can it be parallelized?
Now you may think these aren't useful questions. Real programs are too complicated for such a naive benchmark to be meaningful. You're not wrong! The real answer is "it depends".
That said, I think the question is worth a blog post's worth of exploration. I'm not trying to find the answer. But I do think we can identify some upper and lower bounds, some interesting points in the middle, and hopefully learn a few things along the way.
Numbers Every Programmer Should Know
If you read programming blogs at some point you've probably come across "numbers every programmer should know". It looks something like this.
L1 cache reference                           0.5 ns
Branch mispredict                            5   ns
L2 cache reference                           7   ns                      14x L1 cache
Mutex lock/unlock                           25   ns
Main memory reference                      100   ns                      20x L2 cache, 200x L1 cache
Compress 1K bytes with Zippy             3,000   ns        3 us
Send 1K bytes over 1 Gbps network       10,000   ns       10 us
Read 4K randomly from SSD*             150,000   ns      150 us          ~1GB/sec SSD
Read 1 MB sequentially from memory     250,000   ns      250 us
Round trip within same datacenter      500,000   ns      500 us
Read 1 MB sequentially from SSD*     1,000,000   ns    1,000 us    1 ms  ~1GB/sec SSD, 4X memory
Disk seek                           10,000,000   ns   10,000 us   10 ms  20x datacenter roundtrip
Read 1 MB sequentially from disk    20,000,000   ns   20,000 us   20 ms  80x memory, 20X SSD
Send packet CA->Netherlands->CA    150,000,000   ns  150,000 us  150 ms
Source: Jonas Bonér
This is a great list. I see it on HackerNews at least once a year. Every programmer should know these numbers.
But these numbers are focused on a different question. Latency and throughput are not the same.
Latency in 2020
That list is from 2012. This post comes from 2020, and times have changed. Here are figures for an Intel i7 via StackOverflow.
L1 CACHE hit, ~4 cycles(2.1 - 1.2 ns)
L2 CACHE hit, ~10 cycles(5.3 - 3.0 ns)
L3 CACHE hit, line unshared               ~40 cycles(21.4 - 12.0 ns)
L3 CACHE hit, shared line in another core ~65 cycles(34.8 - 19.5 ns)
L3 CACHE hit, modified in another core    ~75 cycles(40.2 - 22.5 ns)
local  RAM                                                   ~60 ns
Interesting! What's changed?
- L1 is slower;
0.5 ns -> 1.5 ns - L2 is faster;
7 ns -> 4.2 ns - L1 vs L2 relative speed is way closer;
2.5x vs 14x🤯 - L3 cache is now standard;
12 ns to 40 ns - Ram is faster;
100ns -> 60ns
I don't want to draw too many conclusions from this. It's not clear how the original figures were calculated. We're not comparing apples to apples.
Here's some bandwidth and cache sizes for my CPU courtesy of wikichip.
Memory Bandwidth: 39.74 gigabytes per second
L1 cache: 192 kilobytes (32 KB per core)
L2 cache: 1.5 megabytes (256 KB per core)
L3 cache: 12 megabytes  (shared; 2 MB per core)
Here's what I'd like to know:
- What is the upper limit of RAM performance?
- What is the lower limit?
- What are the limits for L1/L2/L3 cache?
Naive Benchmarking
Let's run some tests. I put together a naive C++ benchmark. It looks very roughly like this.
// Generate random elements
std::vector<int> nums;
for (size_t i = 0; i < 1024*1024*1024; ++i) // one billion ints
    nums.push_back(rng() % 1024); // small nums to prevent overflow

// Run test with 1 to 12 threads
for (int thread_count = 1; thread_count <= MAX_THREADS; ++thread_count) {
    auto slice_len = nums.size() / thread_count;

    // for-each thread
    for (size_t thread = 0; thread < thread_count; ++thread) {

        // partition data
        auto begin = nums.begin() + thread * slice_len;
        auto end = (thread == thread_count - 1)
            ? nums.end() : begin + slice_len;

        // spawn threads
        futures.push_back(std::async([begin, end] {

            // sum ints sequentially
            int64_t sum = 0;
            for (auto ptr = begin; ptr < end; ++ptr)
                sum += *ptr;
            return sum;
        }));
    }

    // combine results
    int64_t sum = 0;
    for (auto& future : futures)
        sum += future.get();
}
I'm leaving out a few details. But you get the idea. Create a large, contiguous array of elements. Divide the array into non-overlapping chunks. Process each chunk on a different thread. Accumulate the results.
I also want to measure random access. This is tricky. I tried a few methods. Ultimately I chose to pre-compute and shuffle indices. Each index exists exactly one. The inner-loop then iterates indices and computes sum += nums[index].
std::vector<int> nums = /* ... */;
std::vector<uint32_t> indices = /* shuffled */;

// random access
int64_t sum = 0;
for (auto ptr = indices.begin(); ptr < indices.end(); ++ptr) {
    auto idx = *ptr;
    sum += nums[idx];
}
return sum;
I do not consider the memory of the indices array for my bandwidth calculations. I only count bytes that contribute to sum. I'm not benchmarking my hardware. I'm estimating my ability to work with data sets of different sizes and different access patterns.
I performed tests with three data types:
int- basic 32-bit integermatri4x4- containsint[16]; fits on 64-byte cache linematrix4x4_simd- uses__m256iintrinsics
Large Block
My first test operates on a large block of memory. A 1 GB block of T elements is allocated and filled with small, random values. A simple loop iterates the array N times so it accesses N GB worth of memory to produce an int64_t sum. Multi-threading partitions the array and access the exact same number of elements.
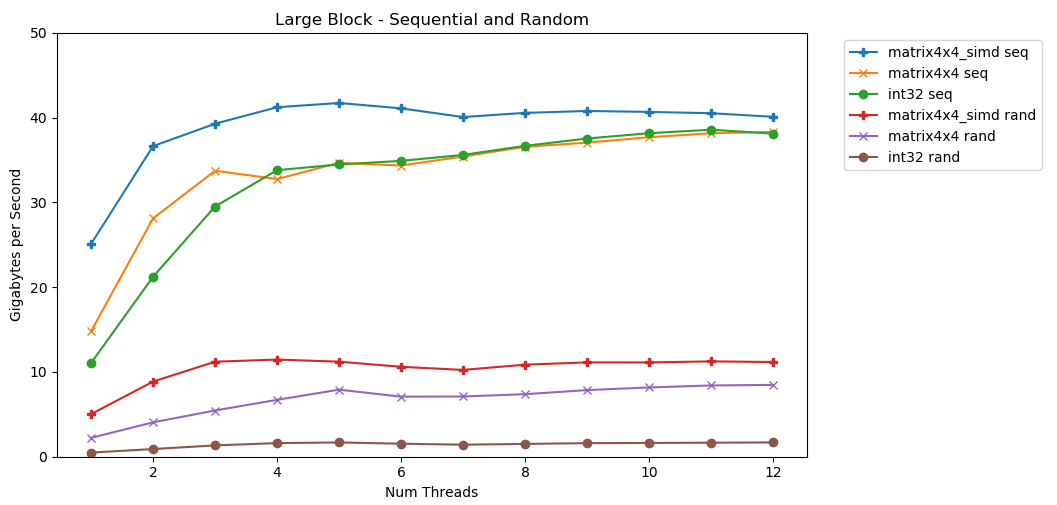
Tada! This plot takes the average time to sum elements and converts it from runtime_in_nanoseconds to gigabytes_per_second.
This is pretty neat. int32 can sequentially read 11 GB/s on a single thread. It scales linearly until flattening out at 38 GB/s. matrix4x4 and matrix4x4_simd are faster, but hit a similar ceiling.
There is a clear and obvious upper limit on how much data we can read from RAM per second. On my system it's roughly 40 GB/s. This lines up with modern specifications listed above.
Looking at the bottom 3 lines, random access is slow. Very very slow. Single-threaded int32 performance is a paltry 0.46 GB/s. This is 24x slower than its 11.03 GB/s sequential sum! matrix4x4 is better since it operates on full cache-lines. But it's still four to seven times slower than sequential and peaks at just 8 GB/s.
Small Block - Sequential
My system has per-core L1/L2/L3 cache sizes of 32 KB, 256 KB, and 2 MB. What happens if we take a 32 KB block of elements and iterate across it 125,000 times? That's 4 GB worth of memory access, but we'll ~always hit the cache.
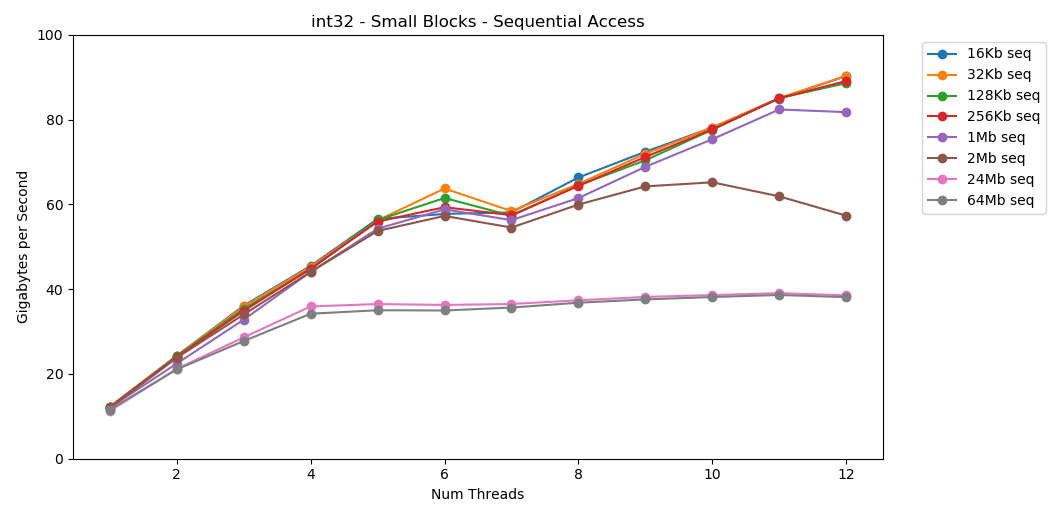
Awesome! Single-threaded performance is similar to the large block read, ~12 GB/s. Except this time multi-threading smashes through the 40 GB/s ceiling. This makes perfect sense. The data stays in cache so the RAM bottleneck doesn't come into play. Data sizes that don't fit into L3 cache hit the same ~38 GB/s ceiling.
matrix4x4 follows a similar pattern, but is even faster; 31 GB/s single-thread, 171 GB/s multi-threaded.
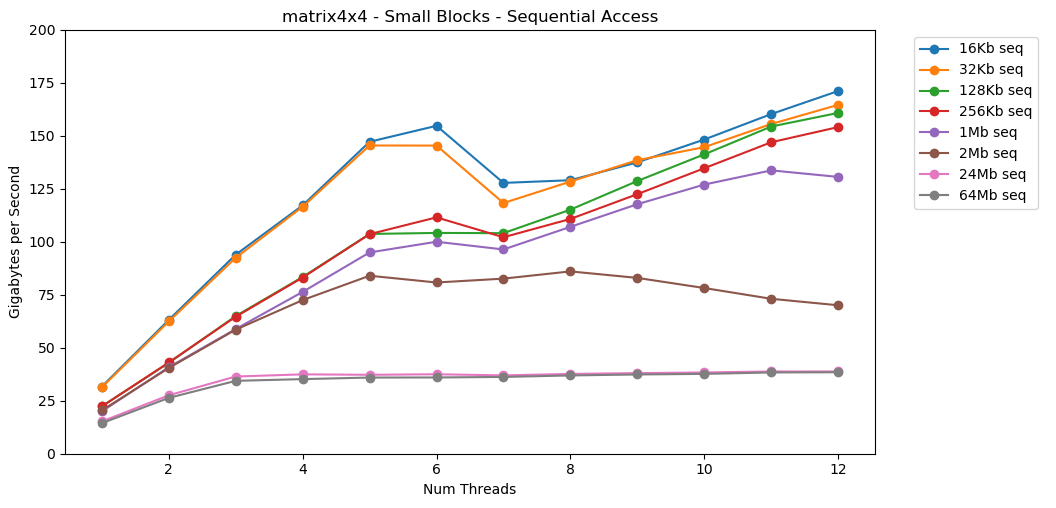
Now let's look at matrix4x4_simd. Pay close attention to the y-axis.
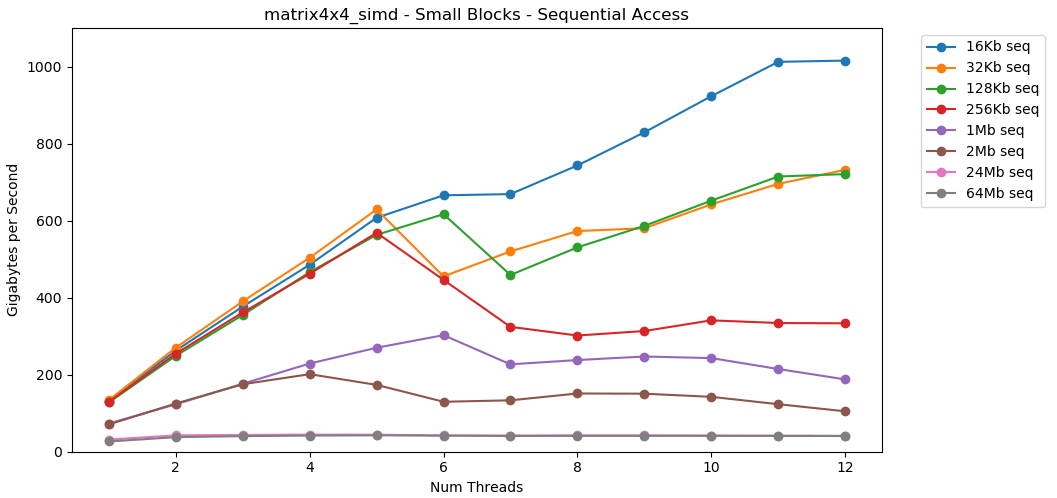
matrix4x4_simd is omgwtfbbq fast. It's upwards of 10x faster than int32. When operating on a 16 KB block it actually breaks 1000 GB/s. 🤯
Obviously this is a superficial synthetic test. Most applications don't perform the same operation on the same data a million times in a row. This is not indicative of real world performance.
But the lesson is real. Operating on data inside the cache is fast. With a very high ceiling when using simd; >100 GB/s single-thread, >1000 GB/s multi-threaded. Getting data into the cache is slow and has a hard cap, ~40 GB/s total.
Small Block - Random
Let's do the same thing, but with random access. This is my favorite part of this post.
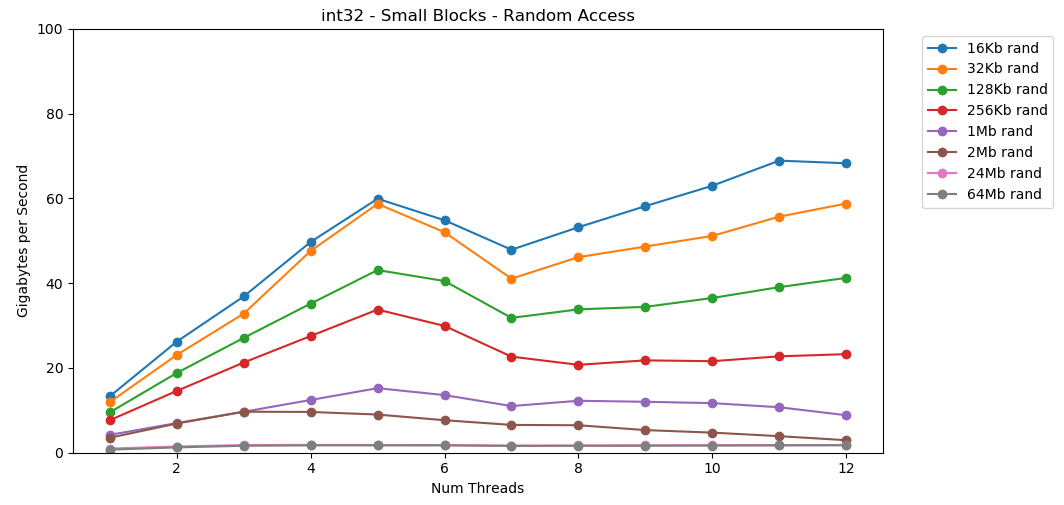
Reading random values RAM is slow, 0.46 GB/s. Reading random values from L1 cache is very very fast, 13 GB/s. This is faster than the 11 GB/s performance we got sequentially reading int32 from RAM.
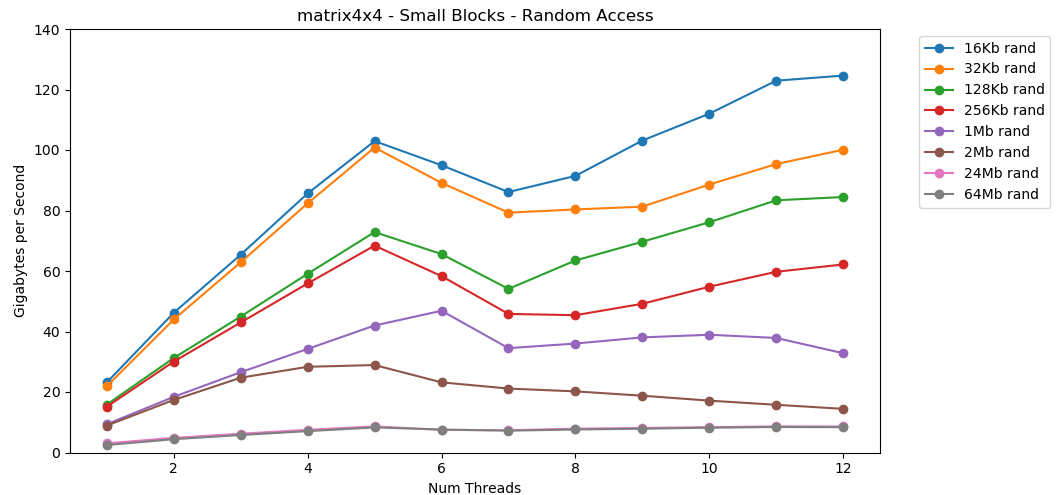
matrix4x4 follows the same pattern, but is ~2x faster than int.
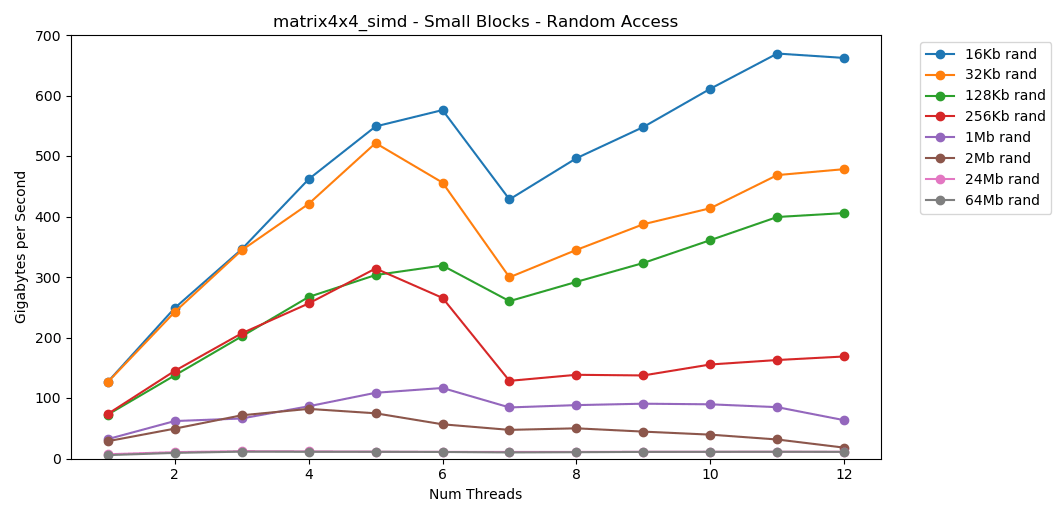
matrix4x4_simd random access is crazy fast.
Random Access Summary
Random access from RAM is slow. Catastrophically slow. Less than 1 GB/s slow for both int32. Random access from the cache is remarkably quick. It's comparable to sequential RAM performance.
Let this sink in. Random access into the cache has comparable performance to sequential access from RAM. The drop off from sub-L1 16 KB to L2-sized 256 KB is 2x or less.
I think this has profound implications.
Linked Lists Considered Harmful
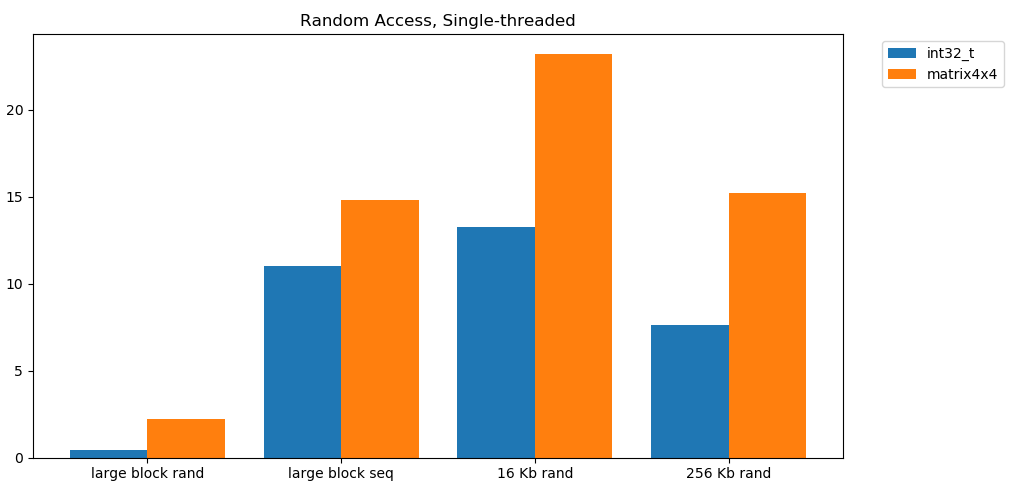
Pointer chasing is bad. Really, really bad. Just how bad is it? I made an extra test that wraps matrix4x4 in std::unique_ptr. Each access has to go through a pointer. Here's the terrible, horrible, no good, very bad result.
     1 Thread       |   matrix4x4   | unique_ptr |  diff  |
--------------------|---------------|------------|--------|
Large Block - Seq   |   14.8 GB/s   |  0.8 GB/s  |  19x   |
16 KB - Seq         |   31.6 GB/s   |  2.2 GB/s  |  14x   |
256 KB - Seq        |   22.2 GB/s   |  1.9 GB/s  |  12x   |
Large Block - Rand  |    2.2 GB/s   |  0.1 GB/s  |  22x   |
16 KB - Rand        |   23.2 GB/s   |  1.7 GB/s  |  14x   |
256 KB - Rand       |   15.2 GB/s   |  0.8 GB/s  |  19x   |


     6 Threads      |   matrix4x4   | unique_ptr |  diff  |
--------------------|---------------|------------|--------|
Large Block - Seq   |   34.4 GB/s   |  2.5 GB/s  |  14x   |
16 KB - Seq         |  154.8 GB/s   |  8.0 GB/s  |  19x   |
256 KB - Seq        |  111.6 GB/s   |  5.7 GB/s  |  20x   |
Large Block - Rand  |    7.1 GB/s   |  0.4 GB/s  |  18x   |
16 KB - Rand        |   95.0 GB/s   |  7.8 GB/s  |  12x   |
256 KB - Rand       |   58.3 GB/s   |  1.6 GB/s  |  36x   |
Sequentially summing values behind a pointer runs at less than 1 GB/s. Random access, which misses the cache twice, runs at just 0.1 GB/s.
Pointer chasing is 10 to 20 times slower. Friends don't let friends used linked lists. Please, think of the children cache.
Estimating Frame Budgets
It's standard for game developers to set CPU and memory allocation budgets for subsystems. But I'm not sure I've ever seen a memory access budget.
Modern games run at increasingly high frame rates. 60 fps is table stakes. VR runs at 90 Hz. I have a 144 Hz gaming monitor. It's awesome and 60fps feels like crap. I'm never going back. E-Sports/Twitch players use 240 Hz monitors. Asus unveiled a 360 Hz monster at CES this year.
My CPU has an upper limit of ~40 GB/s. That sounds like a lot! At 240 Hz that's just 167 MB per frame. A more realistic application might consume 5 GB/s at 144 Hz which is just 69 MB per frame.
Here's a table with a few figures.
        |   1   |   10   |   30   |   60   |   90   |  144   |  240   |  360   |
--------|-------|--------|--------|--------|--------|--------|--------|--------|
40 GB/s | 40 GB |  4 GB  | 1.3 GB | 667 MB | 444 MB | 278 MB | 167 MB | 111 MB |
10 GB/s | 10 GB |  1 GB  | 333 MB | 166 MB | 111 MB |  69 MB |  42 MB |  28 MB |
 1 GB/s |  1 GB | 100 MB |  33 MB |  17 MB |  11 MB |   7 MB |   4 MB |   3 MB |
I believe thinking about problems this way is useful. It can help you realize that some ideas aren't feasible. Hitting 240 Hz isn't easy. It won't happen by accident.
Numbers Every Programmer Should Know (2020)
The "Numbers Every Programmer Should Know" list is out of date. It needs to be refreshed for 2020.
Here are a few numbers for my home PC. They're a blend of AIDA64, Sandra, and my benchmarks. These figures don't tell the whole story and are just a starting point.
L1 Latency:    1 ns
L2 Latency:    2.5 ns
L3 Latency:    10 ns
RAM Latency:   50 ns

(per core)
L1 Bandwidth:  210 GB/s
L2 Bandwidth:  80 GB/s
L3 Bandwidth:  60 GB/s

(whole system)
RAM Bandwidth: 45 GB/s
I think it would be cool if there was a small, simple, open source benchmark tool for this. A single C file that could run on desktop, server, mobile, consoles, etc. I'm not the right person to write that tool.
Disclaimer
Measuring this stuff is hard. Really hard. My code probably has bugs. There are many compounding factors not discussed. If you want to critize my benchmark methodology you probably aren't wrong.
Ultimately I think that's ok. This post isn't about the precise performance of my home desktop. It's about framing problems from a certain perspective. And learning how to perfrom some basic napkin math.
Conclusion
A co-worker shared a way of thinking about programming problems I hadn't considered. That sent me on a journey to explore modern memory performance.
For the purpose of napkin math here's some ballpark figures for a modern desktop PC.
- RAM Performance
- Upper Limit:
45 GB/s - Napkin Estimate:
5 GB/s - Lower Limit:
1 GB/s
- Upper Limit:
- Cache Performance — L1/L2/L3 (per core)
- Upper Limit (w/ simd):
210 GB/s/80 GB/s/60 GB/s - Napkin Estimate:
25 GB/s/15 GB/s/9 GB/s - Lower Limit:
13 GB/s/8 GB/s/3.5 GB/s
- Upper Limit (w/ simd):
Napkin estimates come from observed performance with matrix4x4. RealCode™ is never that simple. But for napkin math estimates I think this is a reasonable starting point. You will need to adjust based on the access patterns and characteristics of your hardware and your code.
That said, the most important thing I learned is a new way to think about problems. Thinking about bytes-per-second or bytes-per-frame is another lens to look through. It's a useful tool to keep in my back pocket.
Thanks for reading.
Source Code
C++ Benchmark
Python Plot
data.json
Future Endeavors
This post just scratches the surface. I probably won't write another post on this subject. But if I did it might cover some of the following:
- Write Performance
- False Sharing
std::atomicperformance (or lack thereof)- Performance counters
- TLB Performance
- Cache Protocols
System Specs
All tests were performed on my home computer. All stock settings, no overclocking.
- OS: Windows 10 v1903 build 18362.
- CPU: Intel i7-8700k @ 3.70 Ghz
- RAM: 2x16 GSkill Ripjaw DDR4-3200 (16-18-18-38 @ 1600 MHz)
- Motherboard: Asus TUF Z370-Plus Gaming