WinDbg Time Travelling Debugger is Amazing Magic
May 12th, 2024
This week I learned that WinDbg has a Time Travelling Debugger. I had no idea this existed, and I suspect I'm not alone! This tool is kinda mind blowing and it feels like more people should know it exists.
Time Travelling Debugger
What is a time travelling debugger (TTD)? Normal debuggers allow you to set breakpoints and step forward through code. A TTD debugger allows you to step backwards. They allow you to freely move forward and backwards in time.
Imagine you have a bug where your program gets into a bad state. A normal debugger will let you inspect the current state. This will merely confirm what you already know! The real question is how did you get into this bad state. A TTD debugger will allow you to work backwards to root cause the bad logic that caused the bad state.
How it Works
How does the WinDbg Time Travelling Debugger work under the hood? As far as I'm concerned it's pure black magic.
What I do know is that WinDbg's TTD works at the instruction level and requires zero instrumentation. It is, somehow, deterministic even when threading is involved!? 🤯
You can read their paper Framework for Instruction-level Tracing and Analysis of Program Executions to learn more.
Example - Memory Stomp
A common class of bugs is stomped memory. Tools like Valgrind can help detect use after free. But what happens if valid memory gets stomped? That's much trickier.
Here's a simple example that involves two threads.
void reader_thread(int** ptrs, size_t count) {
    int sum = 0;

    // Accumulate forever!
    while (true) {
        sum += *ptrs[idx]; // 💣💥... eventually
        idx = (idx + 1) % count;
    }
}

void stomper_thread(int** ptrs, int count) {
    // STOMP! 🥾
    ptrs[rand() % count] = (int*)0xbadf00d;
}
Assume these two functions are running on different threads. The reader accumulates numbers forever. At some point the stomper thread changes a random pointer to 0xbadf00d. This will cause the reader thread to explode with the exception: Access violation reading location 0x000000000BADF00D.
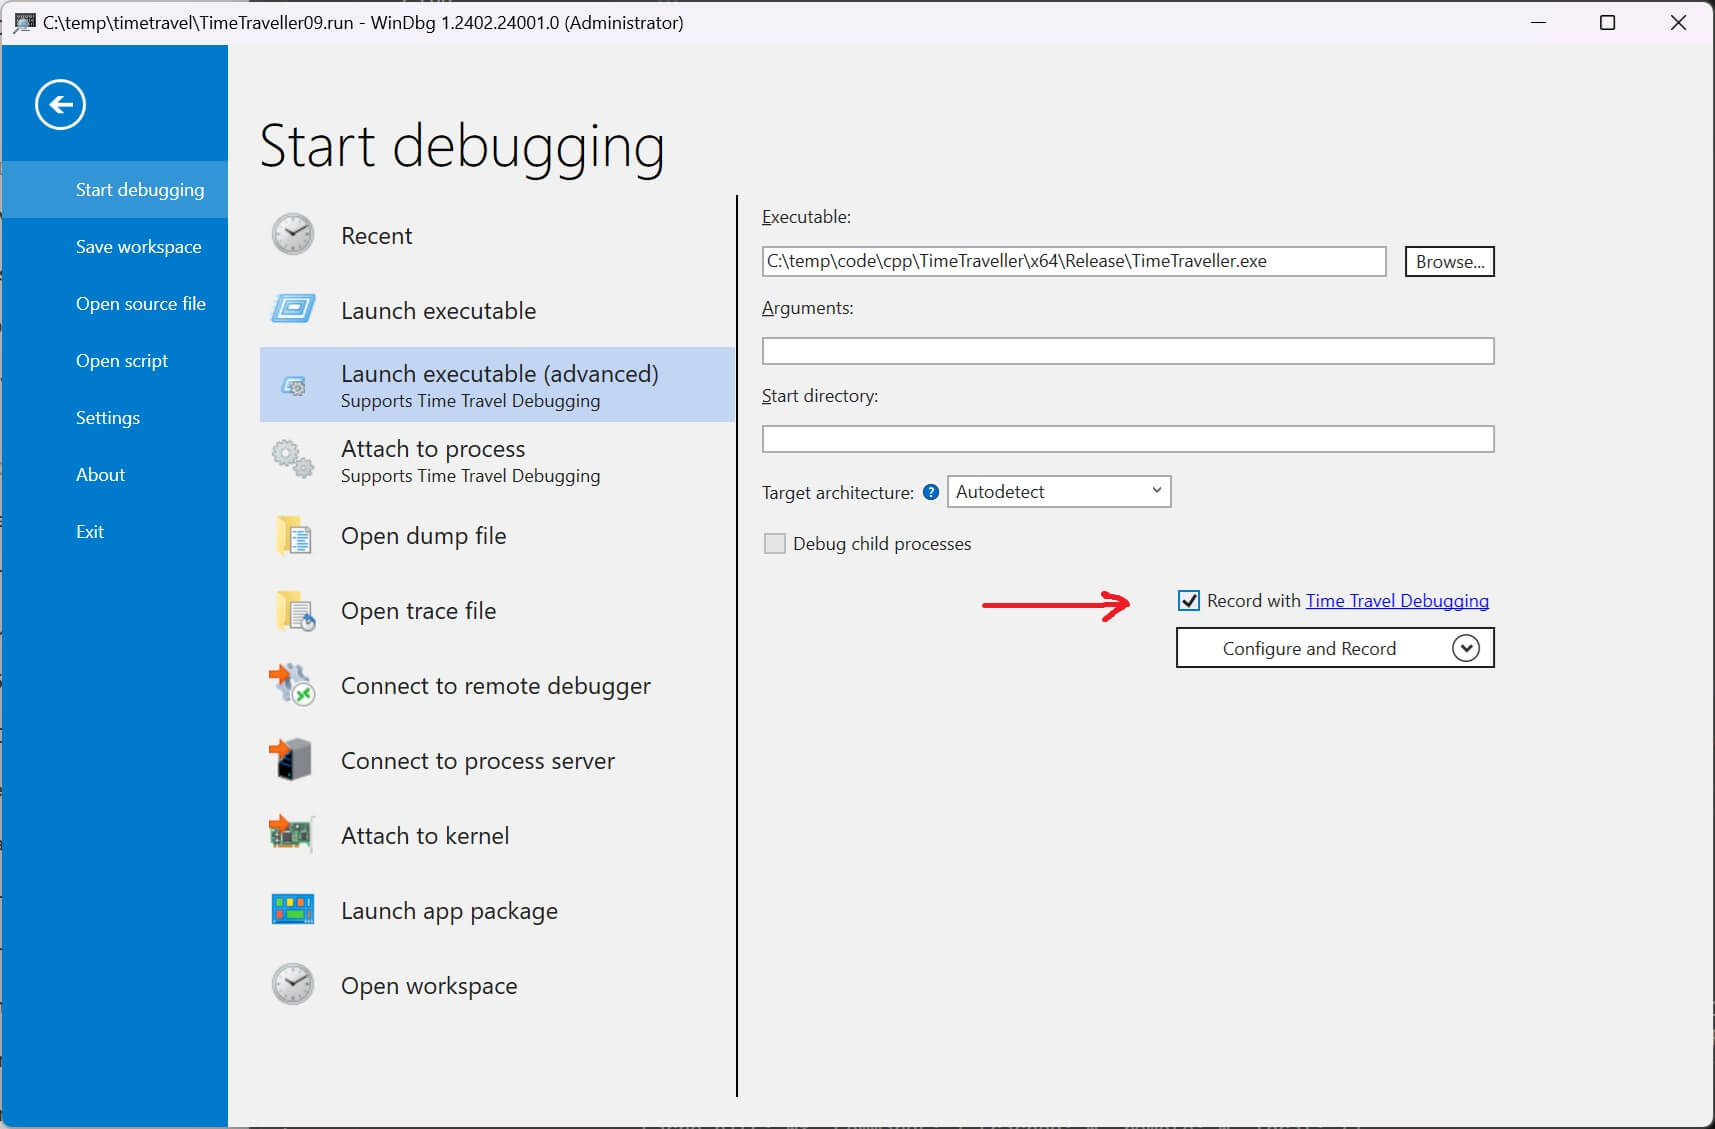
Let's capture a trace. Install WinDbg and run as admin. Then it's just a simple checkbox.
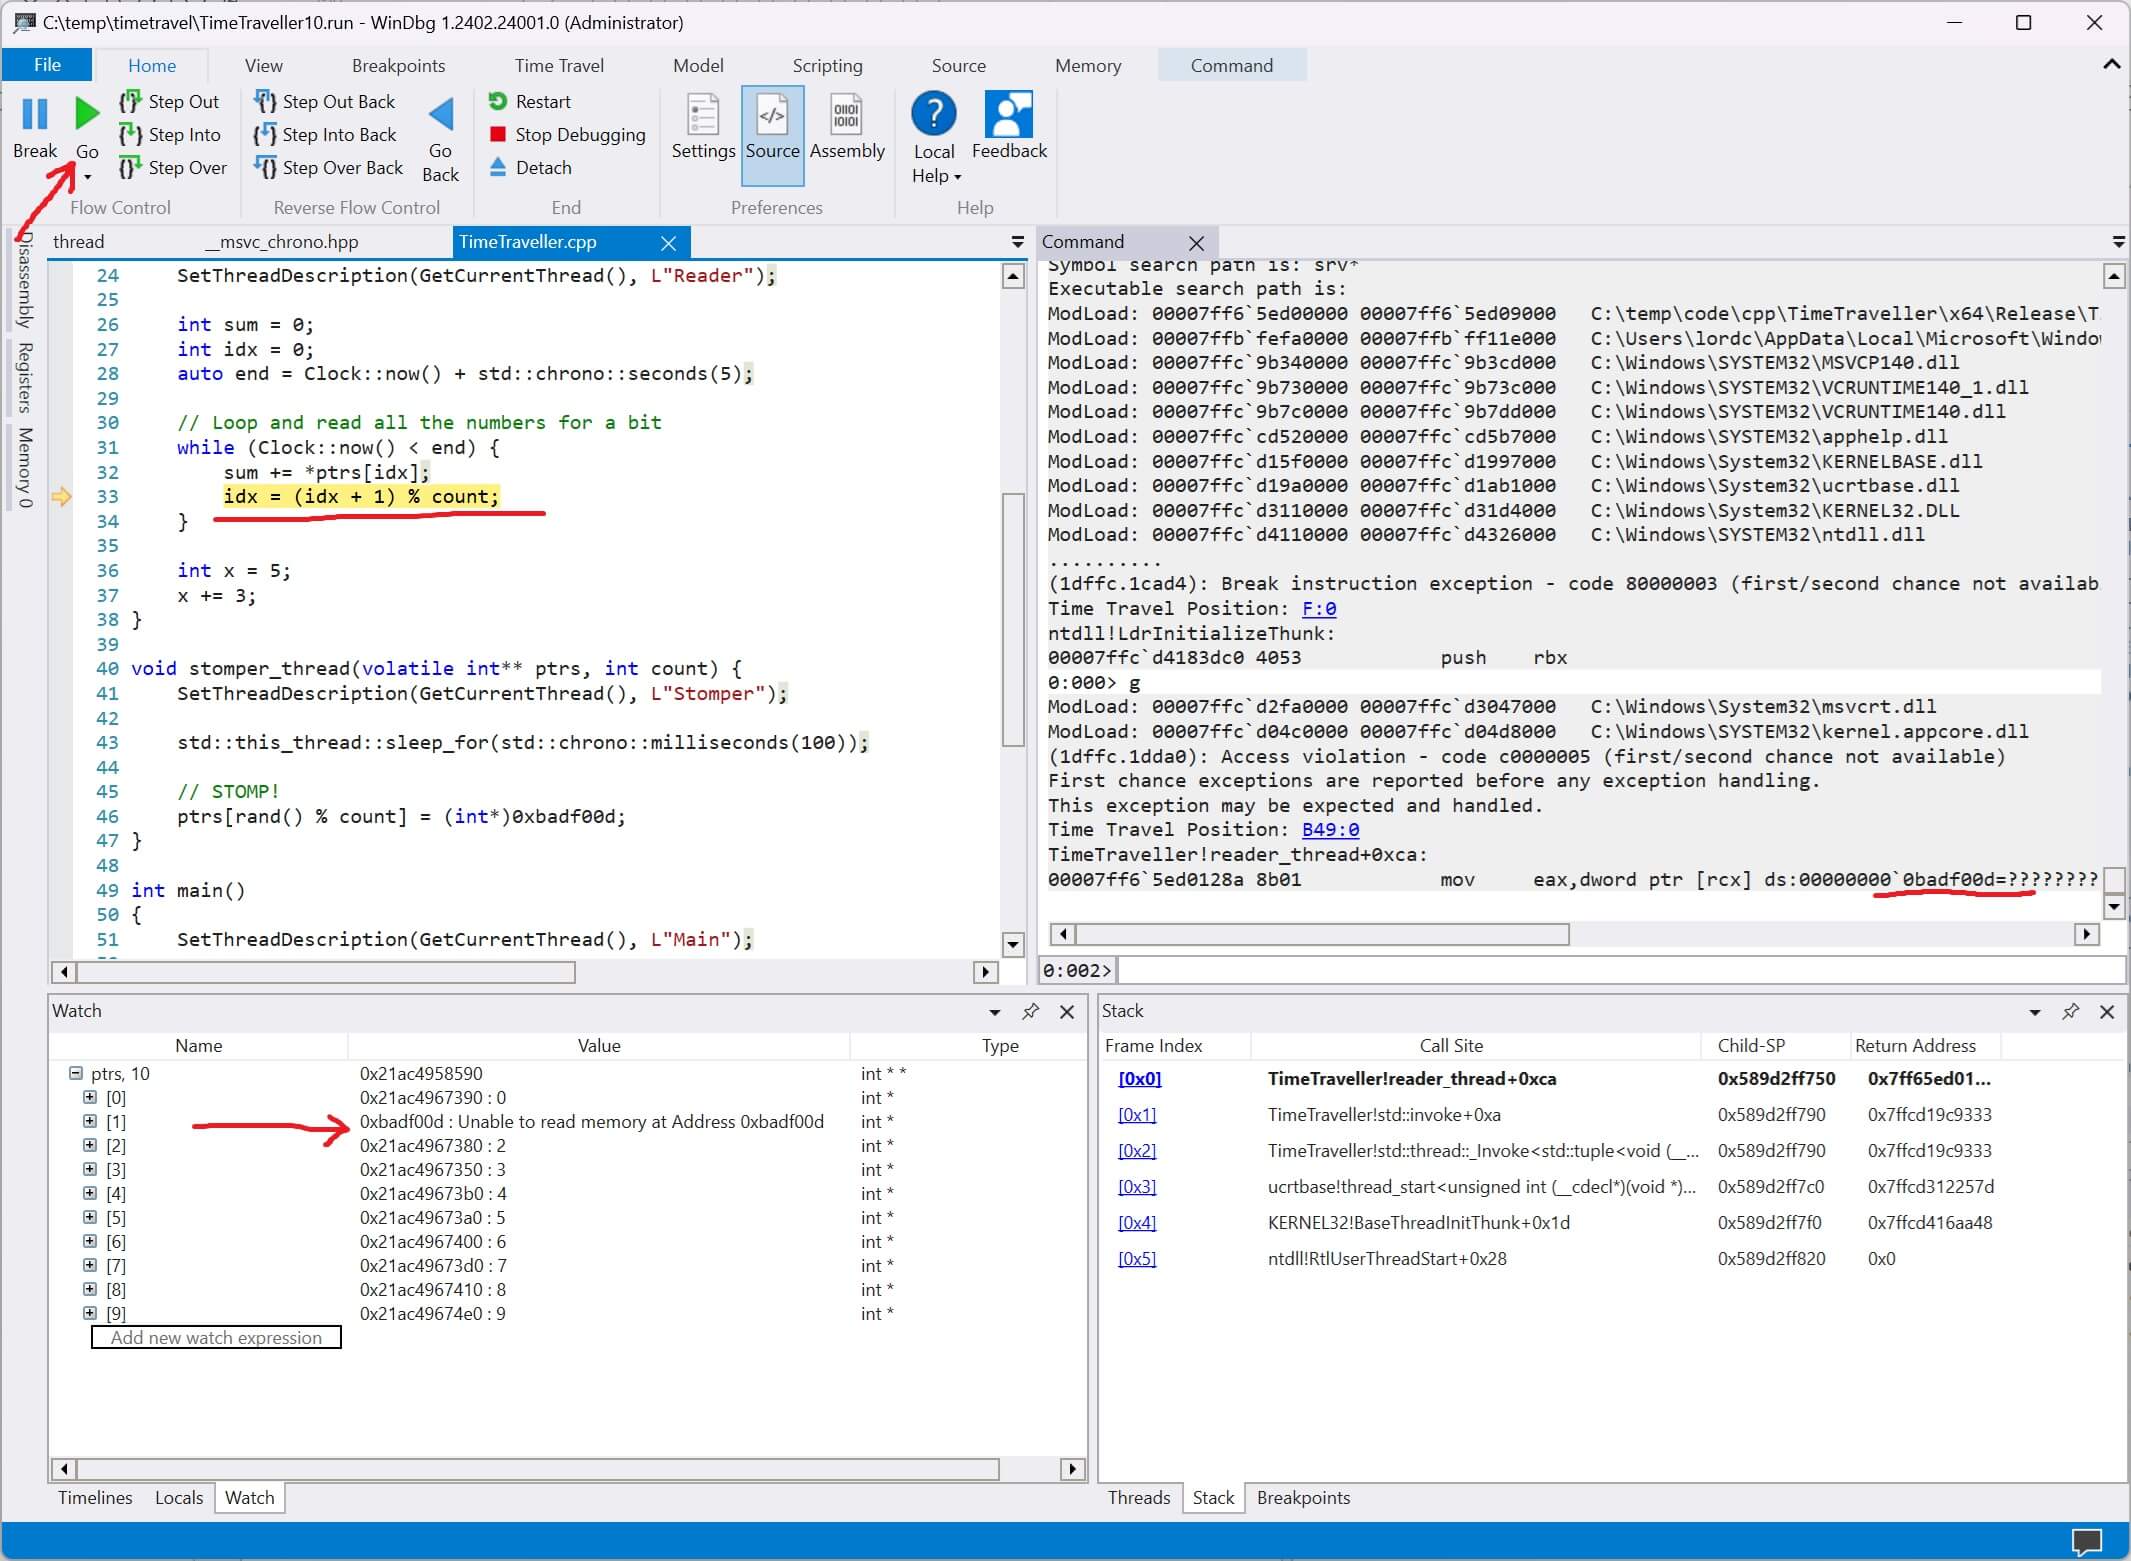
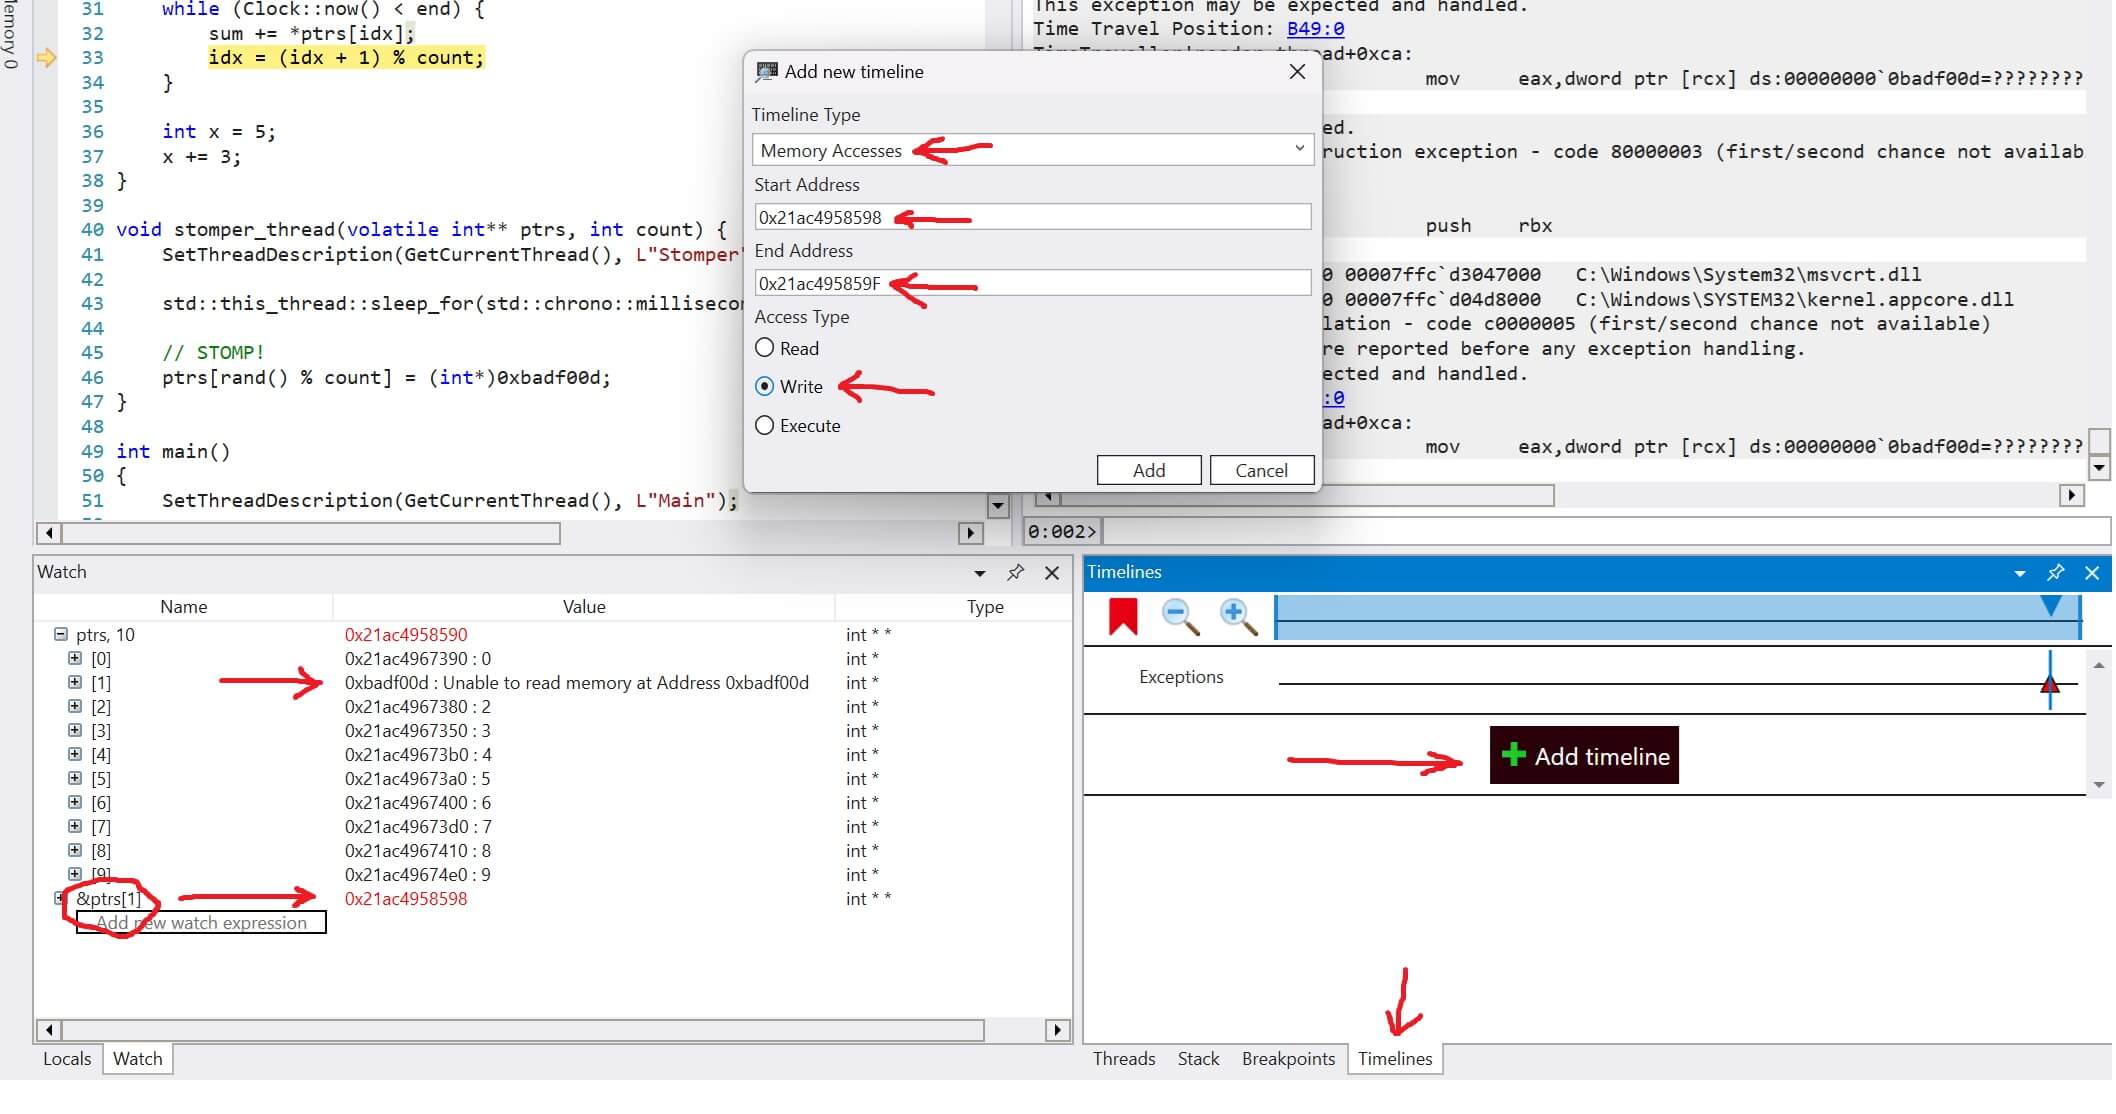
We quickly see the exception regarding 0xbadf00d. In the watch window we can see that one of our pointers is 0xbadf00d. We know what the problem is. How do we figure out what caused it?
We create a new memory event under the timeline window. We get the address of the pointer that was stomped, 0x21ac4958598, and create a new timelime that marks anytime that memory address is written.
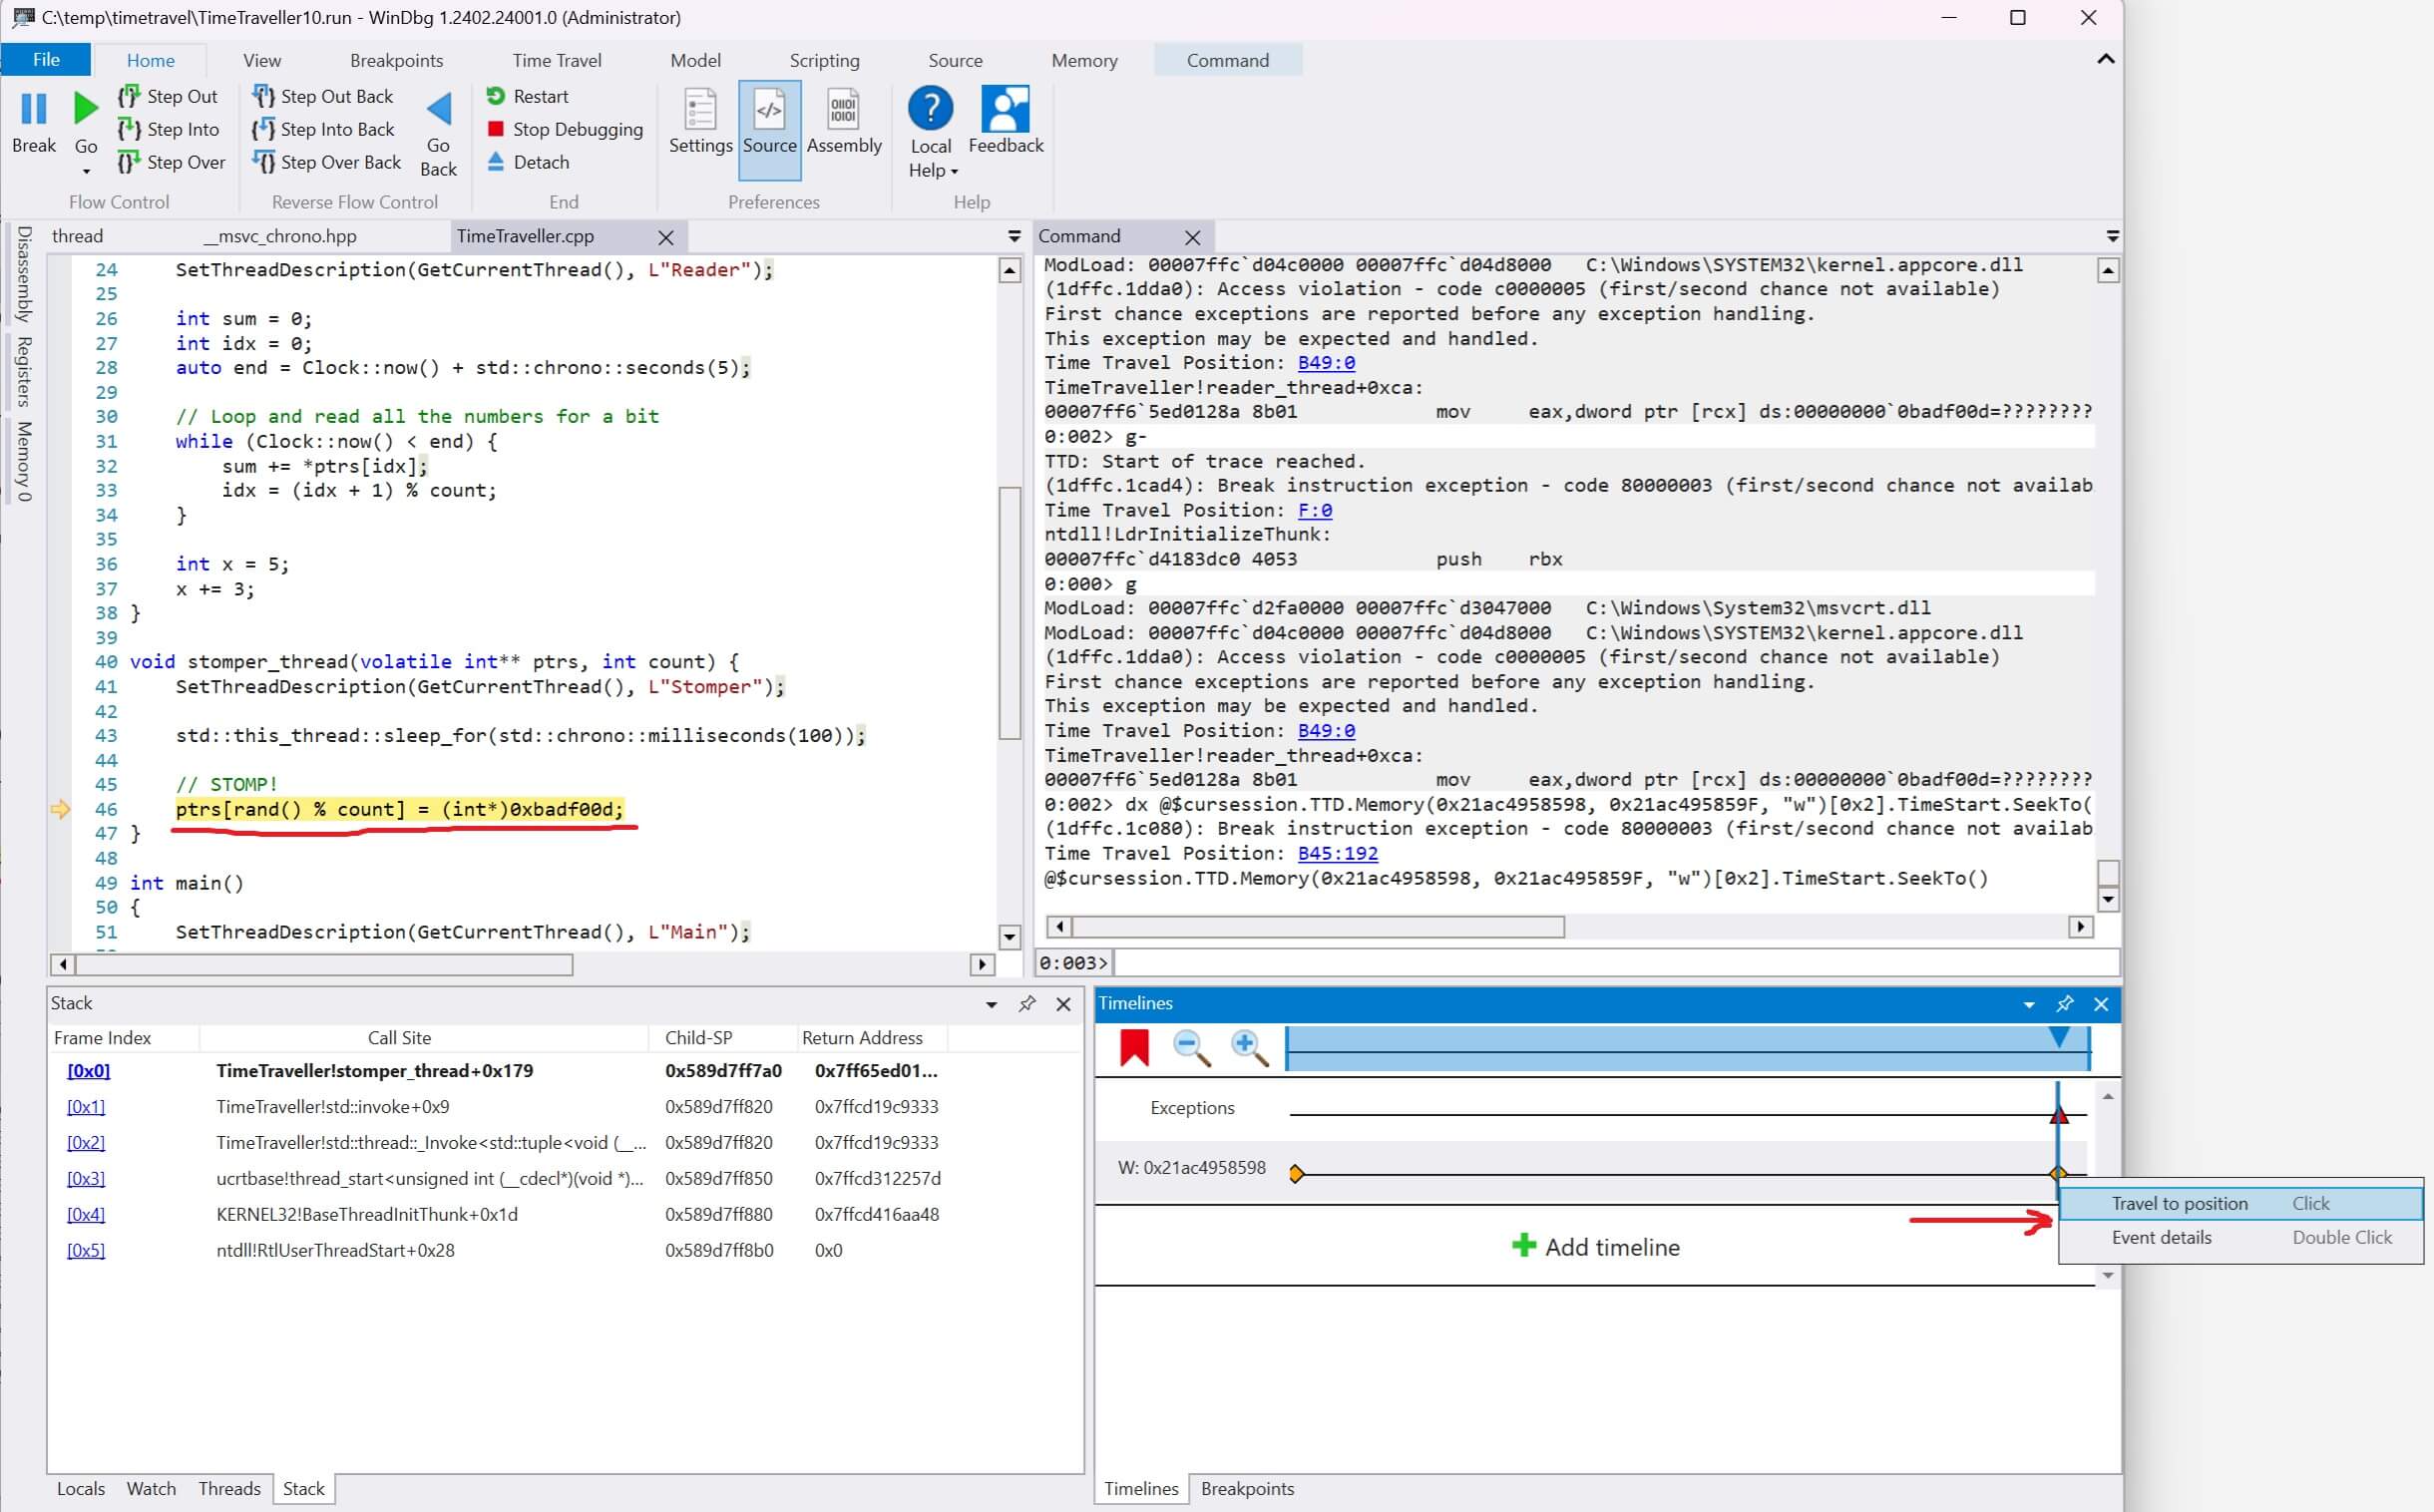
Then we right-click the event and select "travel to position". Voila! We now see the exact line of code and callstack that modified that memory address.
Example - Stack Corruption
Let's consider another example. Here I purposefully corrupt the callstack.
__declspec(noinline) int corrupt_stack() {
    int nums[10];

    // Way out of bounds!
    for (int i = 0; i < 100; ++i)
        nums[i] = rand();

    return nums[rand() % 10];
}
When we capture a trace the callstack is predictably garbage.
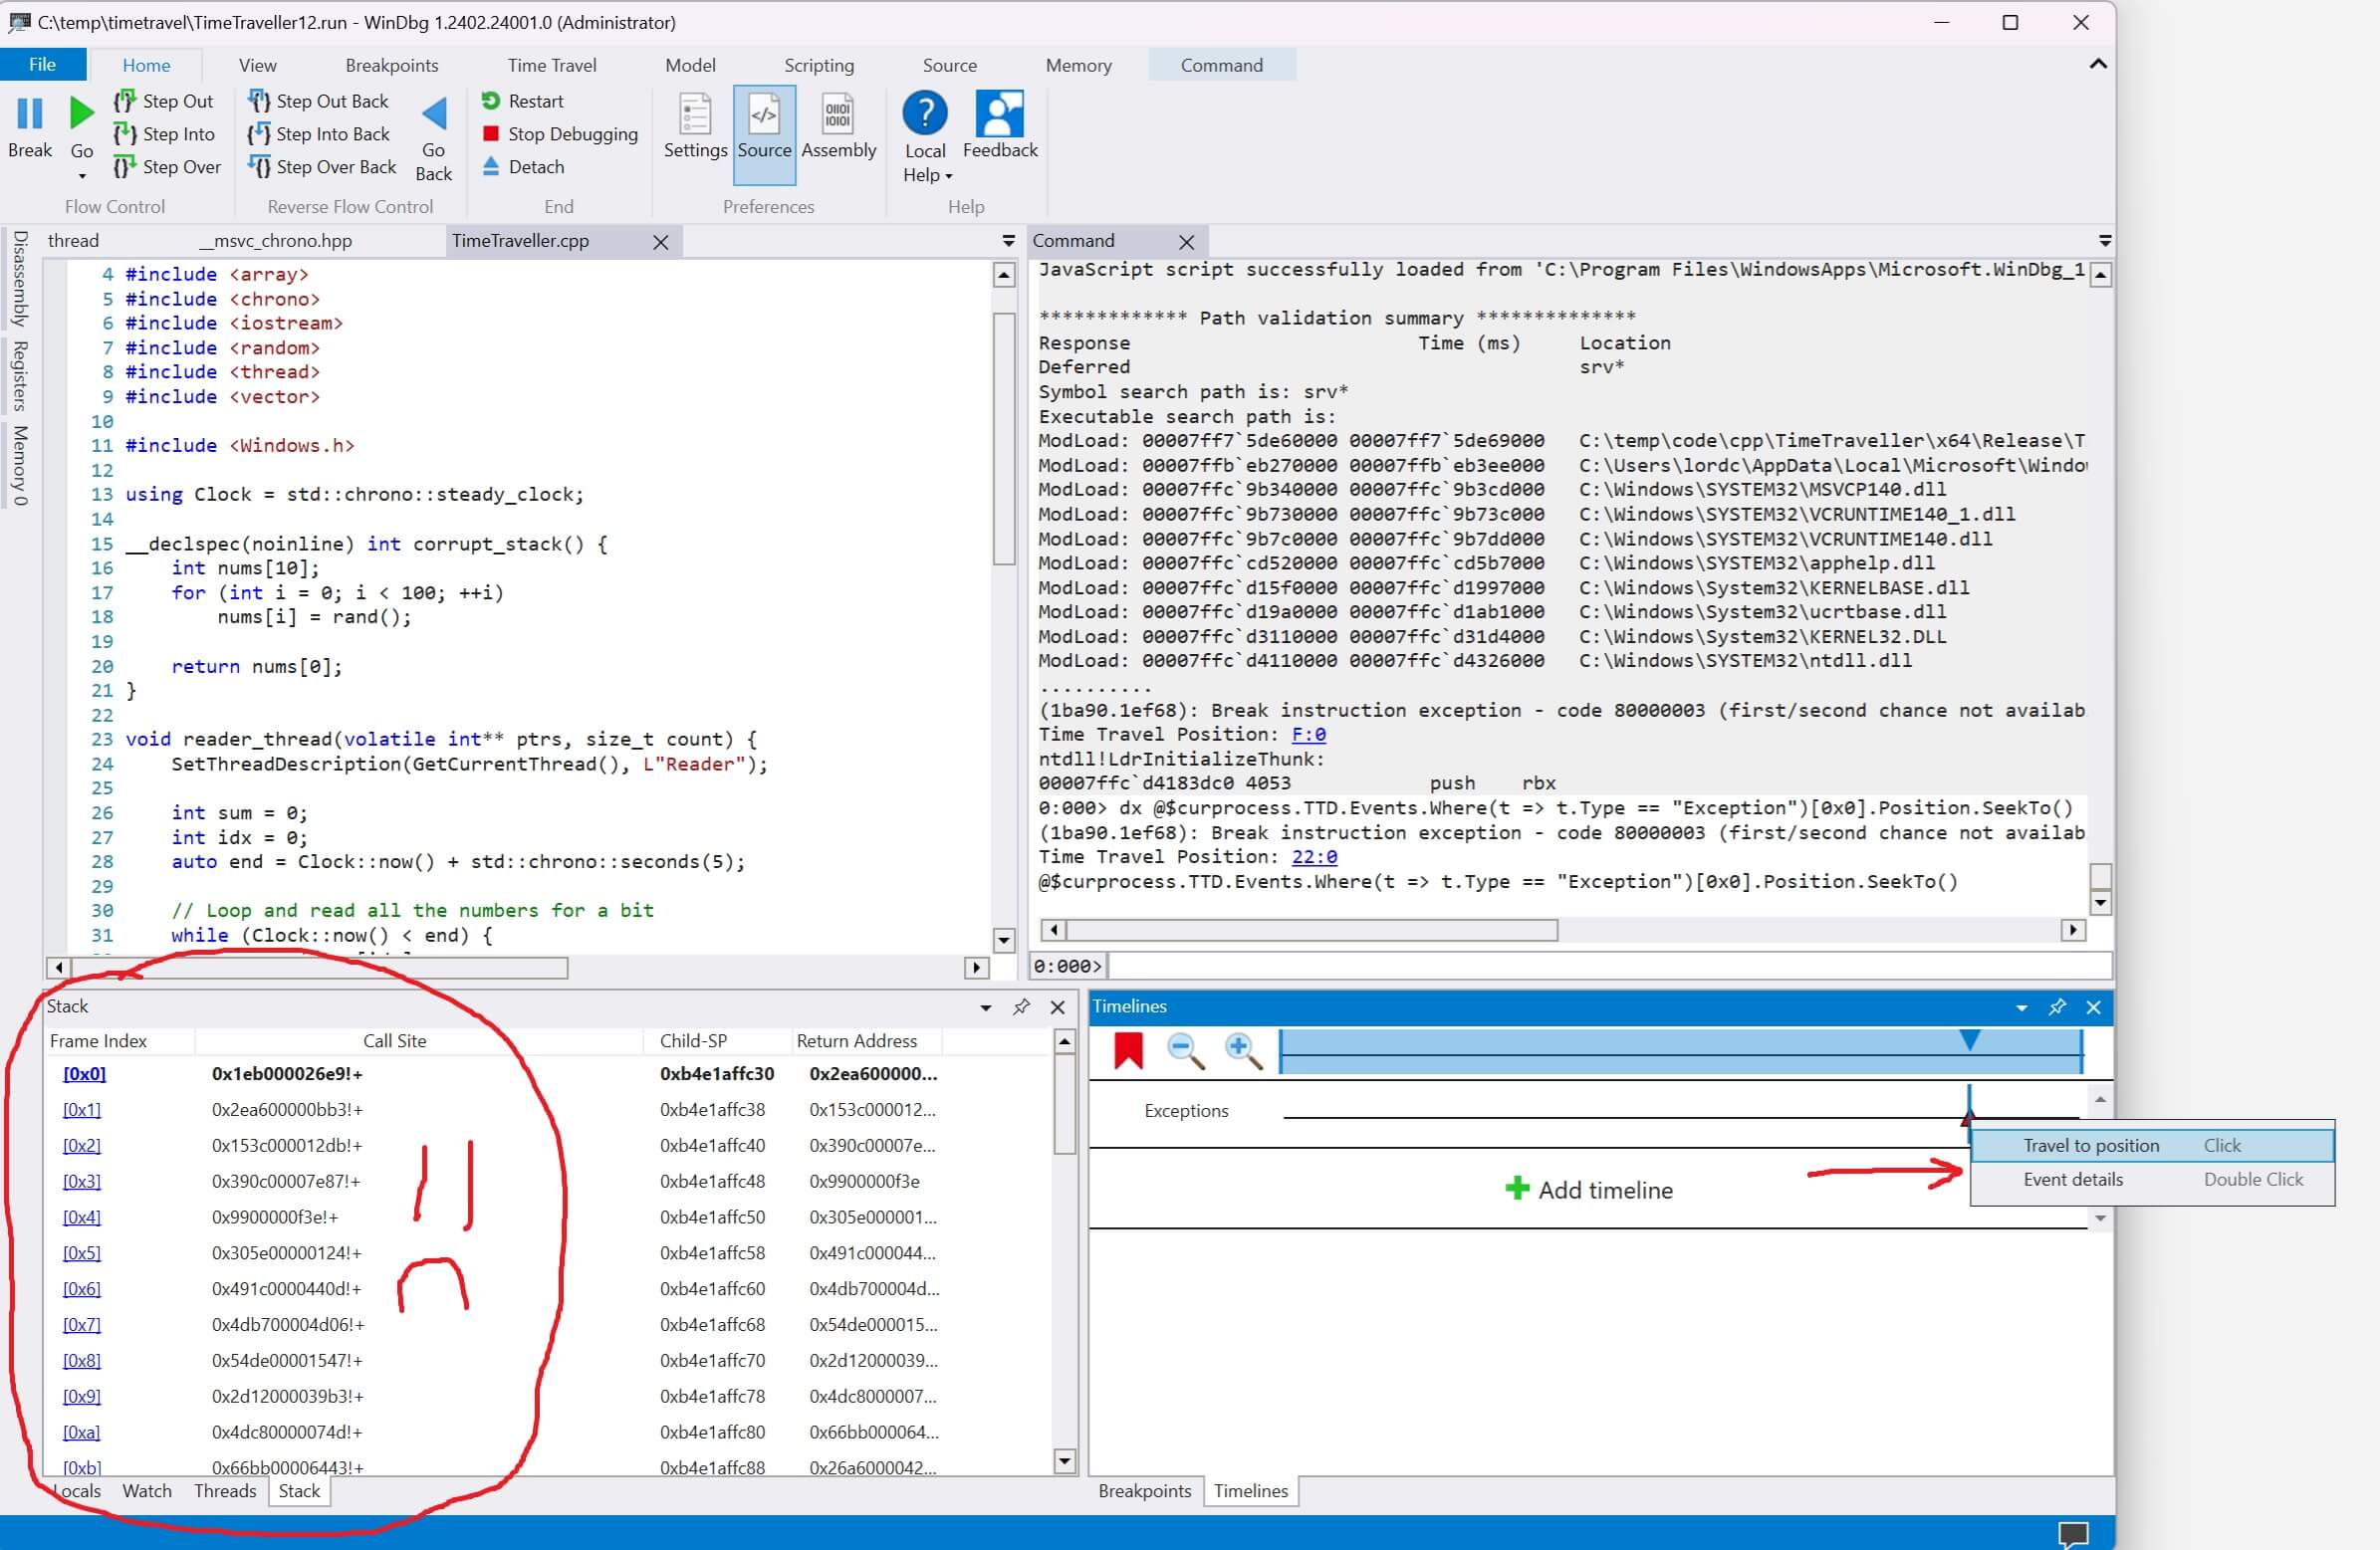
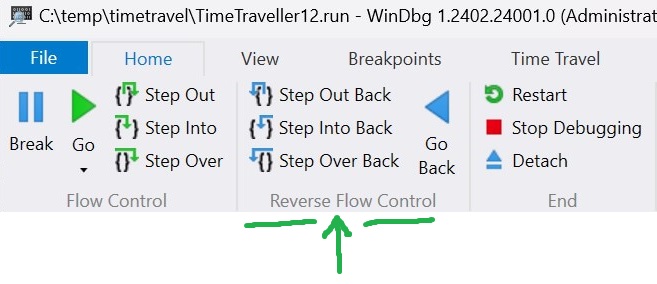
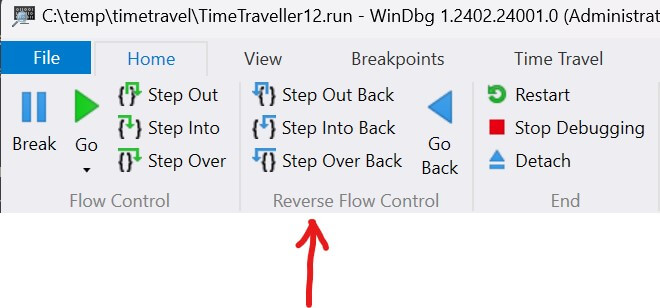
How can we figure out what happened? By stepping backwards!
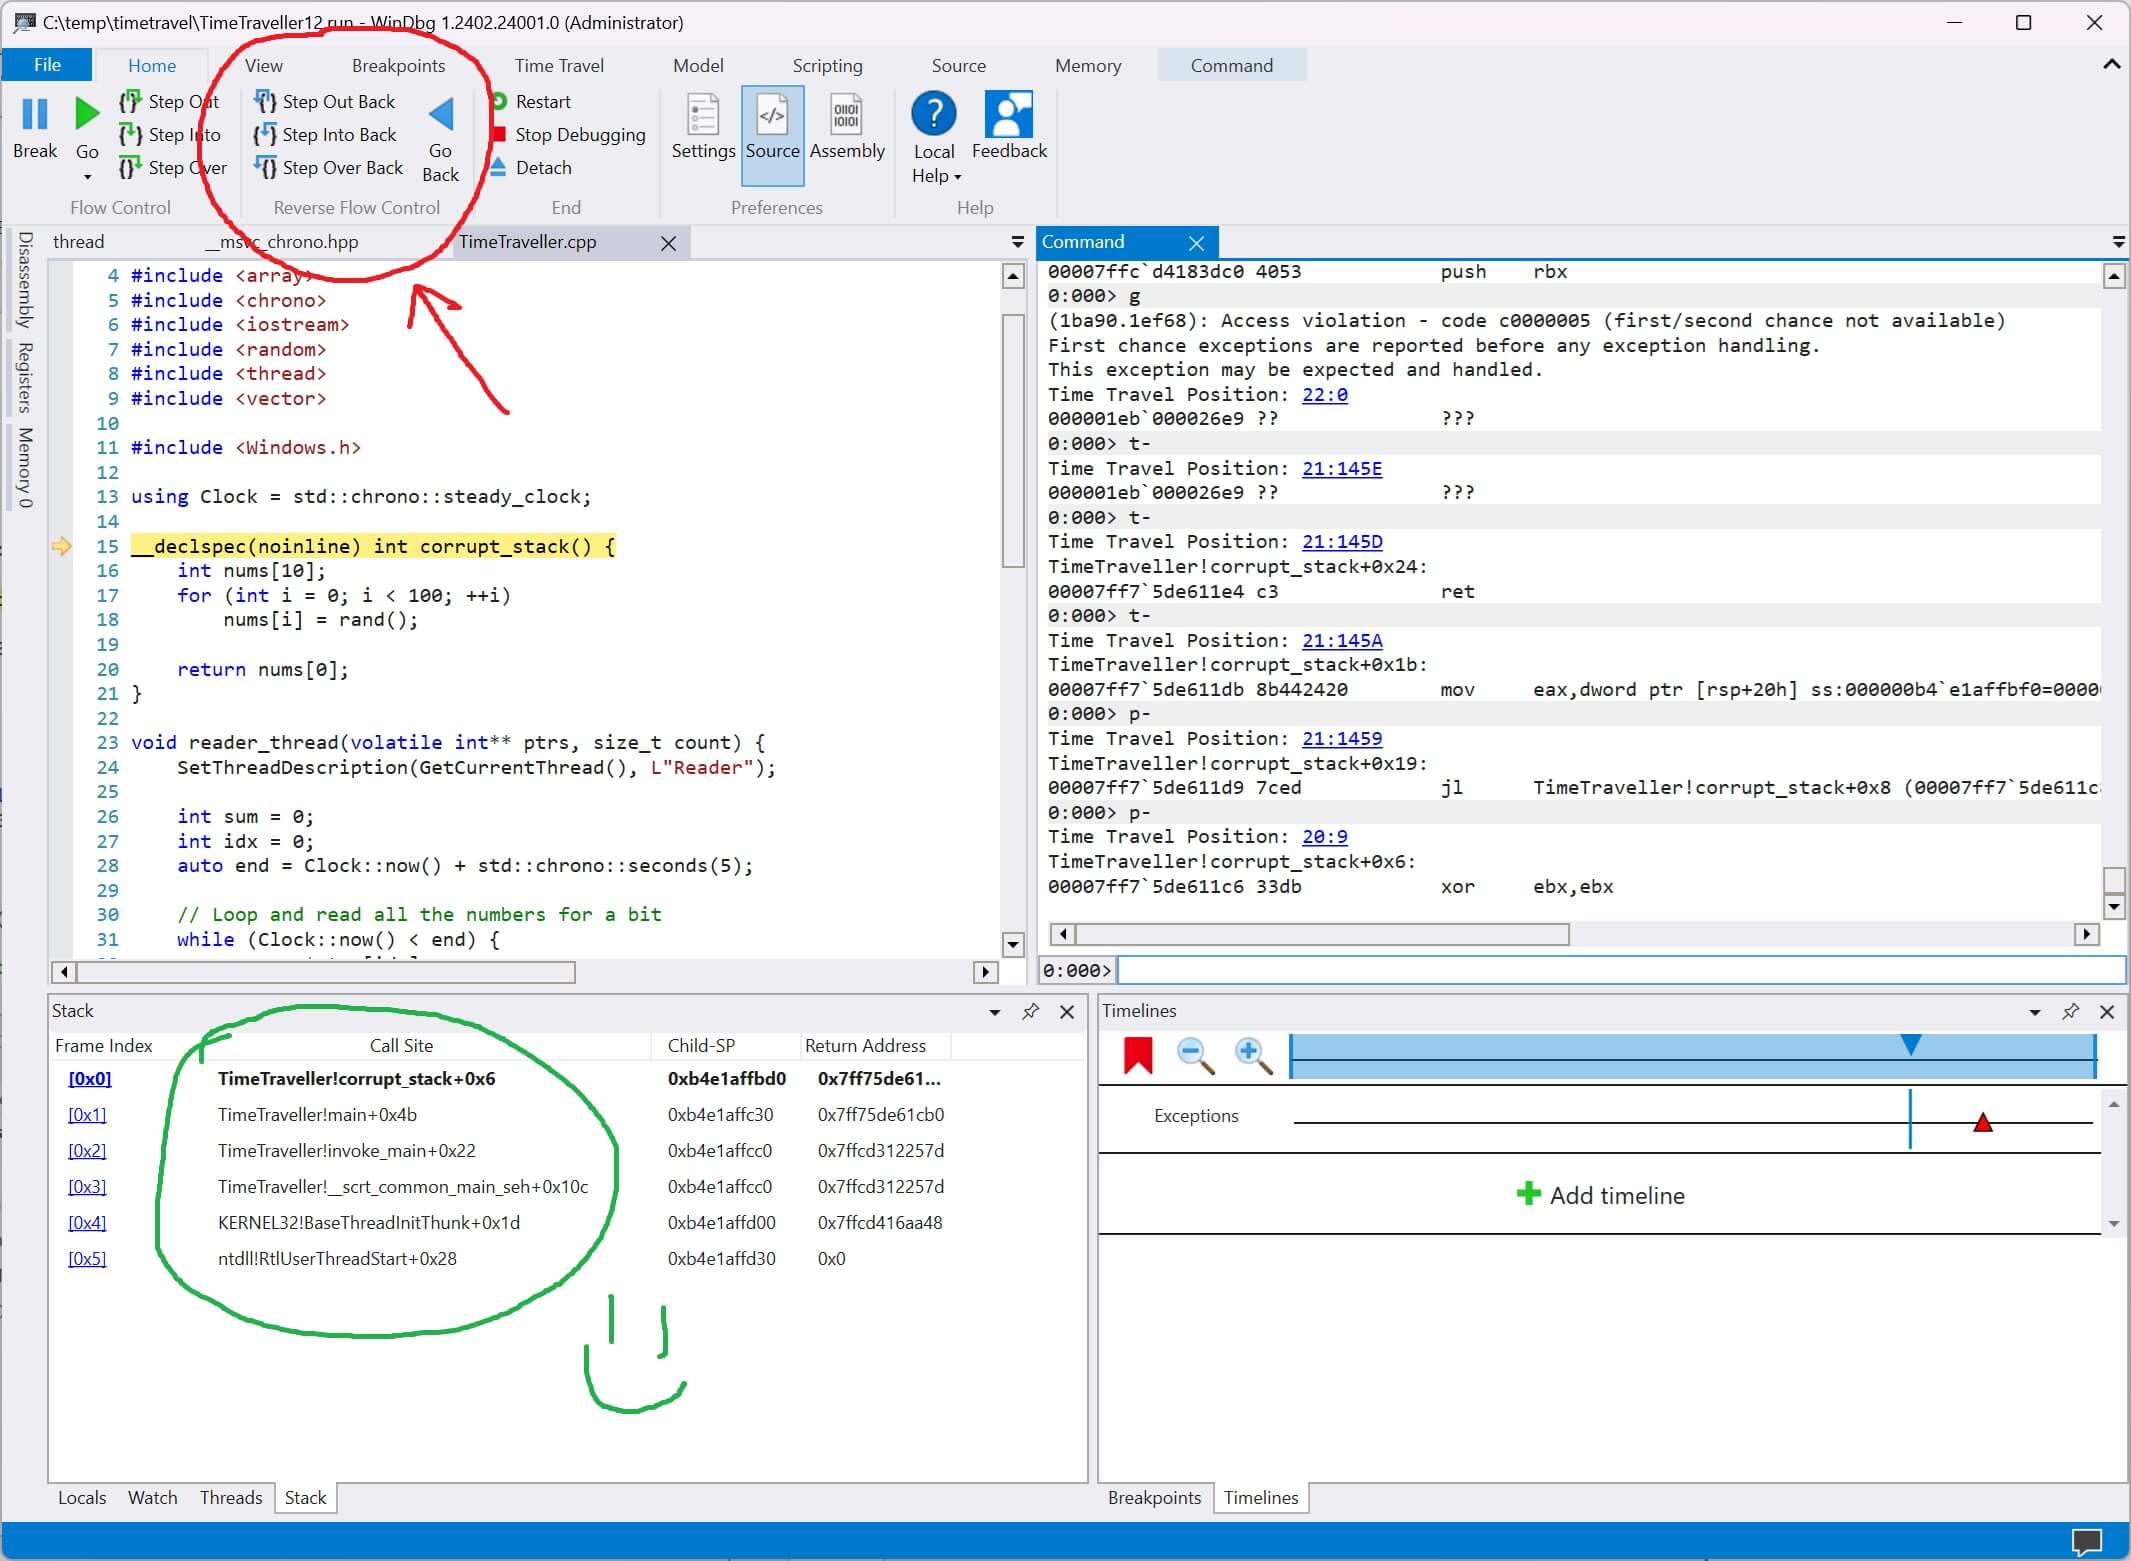
If we click step out back and step over back a few times we'll quickly find a correct callstack. It can be narrowed down to a single step statement that corrupts everything.
If you accidentally step too far that's ok! You can freely move forwards and backwards with zero data loss.
Caveats
What are the downside to this time travelling magic? Exactly what you think.
- 5x to 20x performance loss
- Trace files are ~gigabytes per second
Running with the WinDbg TTD is slow and it generates massive trace files. The good news is you can attach to a running process.
Thus far I've only used it to debug toy examples. It's possible that in practice the amount of data it generates in a "real program" is too much to be useful. I'm not sure.
Valgrind
You may be thinking to yourself - wouldn't Valgrind or similar memory tools have caught these issues? Yeah probably.
The real magic in a TTD is being able to root cause complex state issues. Unfortunately those are really hard to represent in a blog post! Use your imagination.
Conclusion
A week ago I didn't know that WinDbg Time Travelling Debugger existed. Now I do! I suspect if you're reading this then you probably didn't know about it either.
Debugging requires a deep bag of tricks. This seems like one that could be super useful on a rainy day.
Thanks for reading.