
My Favorite Paradox
April 3, 2016
We live in the age of Big Data. Free-to-play games collect 300gb of data per day. Websites track every pixel you touch. There are so many A/B services that you can A/B test which A/B service is best.
There are three kinds of lies: lies, damned lies, and statistics.— Mark Twain
Bad actors can twist and manipulate numbers to say what they want. We all know how they play the game.
There’s another, more subtly dangerous side. The side where smart, educated, well reasoned individuals reach a conclusion that isn’t merely wrong, but is the complete opposite of right. It happens in frightfully easy ways.
Simpson's Paradox
In 1973 the University of California, Berkley was sued for bias against women applicants to their graduate programs. Men were favored to women by 44% to 35%.
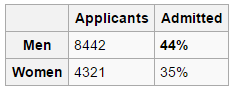
Source: Wikipedia
The lawsuit triggered a study. The study results showed that not only were women not discriminated against, but that women had a statistically significant advantage! How is that possible? The data seemed clear. The answer is Simpson’s Paradox.
Trends which appear in groups of data may disappear or reverse when the groups are combined.
Here’s what happened. Some departments had high acceptance rates and some had low acceptance rates. Women applied to more competitive departments. Men applied to more accessible departments. Taken on the whole men had an advantage. When broken down per department it was women who were more favored.
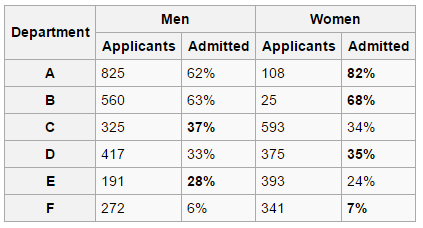
Source: Wikipedia
This lawsuit actually happened and is one of the most famous examples of Simpson’s Paradox.
I find this paradox delightful. I like it because it doesn’t merely change or skew the result. It completely flips the conclusion. And it’s so easy to do on accident!
Kidney Stones
There are two different treatments for kidney stones. Which one is better?
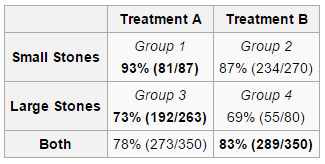
Treatment A — 273 successful out of 350 (78%)
Treatment B — 289 successful out of 350 (83%)
The correct answer is… Treatment A! Weird right? What’s the difference this time?
Source: Wikipedia
Kidney stones can be classified as either large or small. Large stones are harder to treat. Treatment A is better at small stones 93% to 87%. It’s also better at large stones 73% to 69%.
Each treatment was given 350 times. The critical difference is how the treatments were split small stones vs large stones.
Treatment A — 87 small / 263 large
Treatment B — 270 small / 80 large
When taking a single average across all 350 patients Treatment A’s average will skew towards the lower success rate of large stones. Treatment B’s average will skew towards the higher success rates of small stones. Treatment A’s combined average is then lower despite being better at both small and large stones!
Onion Peeling
I view Simpsons’s Pardox like peeling off the layers of an onion. The top layer of kidney stone analysis said Treatment B was better. After peeling off a layer and considering small stones vs large stones separately Treatment A was better in both cases.
If we looked deeper again we might find Treatment B is better in at least some circumstances. Maybe it’s better for eldery patients. Or small stones in obese patients. Or large stones in patients with another condition. And so on and so forth.
Here is Simpson’s Paradox once again.
Trends which appear in groups of data may disappear or reverse when the groups are combined.
I love this because every layer you peel off can invert your conclusion. At first glance B is better. Look deeper and A is better. Look deeper still and B may be better again.
Video Games
Simpson’s Paradox applies to college admissions, medical procedures, and your video game all the same. Accurate data analysis is really damn hard!
Here’s a bit of a thought experiment. A common scenario and different underlying issues that I’ve all seen first hand.

Your players claim Sniper is overpowered. Because of course they do. But what does the data say?
- Sniper averages more kills per game than other classes.
Well sure enough. Maybe your players are right. Let’s peel off a layer and see what’s next.
- Sniper averages many kills at low skill levels.
- Sniper is played less frequently at high skill levels.
- Sniper is more dominant on certain maps.
We could start making adjustments off this data. There’s a couple of obvious knobs to tweak.
But we shouldn’t change anything just yet. We’ve not gone deep enough. We need to peel back more layers. Here’s seven different scenarios I’ve seen first hand that each warrant a different change.
- Sniper is easy to play but has a low skill cap.
- Sniper hard counters classes played more frequently by new players.
- Sniper is too strong on certain maps due to long sight lines.
- Sniper counters enemy classes naively played on certain maps.
- Sniper is fine but a synergizing OP support class is played more frequently on certain maps.
- Sniper is fine but skill rating system fails to promote high skill Snipers to high skill tiers.
- Sniper is fine but the skill rating system incorrectly promotes mid skill Snipers to high skill tiers.
The last two points are my favorite. First, the lack of snipers at high skill play might not have anything to do with gameplay! Second, there are two relatively opposite conditions that lead to similar negative outcomes.
Theorem Theory
I’ve got this idea. An unproven theorem if you will.
For any given statistical result and conclusion there exists a data set that produces the same result but opposite conclusion.
I think anytime you’ve reached a statistical conclusion you need to ask yourself what if. What if you’re in the middle of Simpson’s Paradox? What if you peeled off another layer and that reversed your conclusion?
If you proactively ask yourself what if you may find your conclusion is correct. Or you may find you’re caught in a paradox and going the wrong way.
Conclusion
No matter how much data you have you still have to ask the right questions. It’s painfully easy to have good intentions but ask the wrong question and find the wrong answer.
Simpson’s Paradox is just one example how easy it is to get turned around. Being aware of it’s existence and constantly asking yourself what if is essential to staying on the right path.
Bonus!
Here’s one more example of Simpson’s Paradox in action. I felt like two classic examples with hard numbers were better for learning. But this is such a good story I had to squeeze it in.
This is all from a 2012 post titled Page Weight Matters. Chris Zacharias was a web developer on YouTube and took some time to optimize the video watch page. Over time it had grown to 1.2 megabytes making page load times unnecessarily slow.
With a few days work Chris shrunk the page size to a mere 98kb. He even decreased the request count and swapped out a bulky Flash player for a speedy HTML5 player. Everything was great so he pushed it live.
After a week of data collection the numbers came back and… the new code was slower! Page latency had increased. Despite being 10% as large it was somehow taking longer to load on average.
Enter Simpson’s Paradox.
To avoid a paradox it’s essential to know exactly what groups you are measuring. If you have a group that used old code and a new group using new code and you compare averages that doesn’t tell you a damn thing unless you understand the makeup of each group.
In Chris’s case the new improved code was getting a lot of new traffic from Southeast Asia, South America, and Africa. These places were averaging two minutes to load. Under the old code it would have taken them twenty minutes.
Chris’s code wasn’t just a success. It was a radical success. Twenty minutes was too long to be usable. Two minutes is slow but good enough. Entire populations of people who couldn’t use YouTube before were suddenly able to.
Yet the initial data analysis called it failure. It has to make you wonder: How many times have you been caught in a paradox and not known it? How many times have you used data to make the completely wrong choice? My money says more than zero.